Which analysis technique fits your question?
From descriptive to prescriptive: choose the technique that fits your question and data.
Schedule a no-obligation consultation
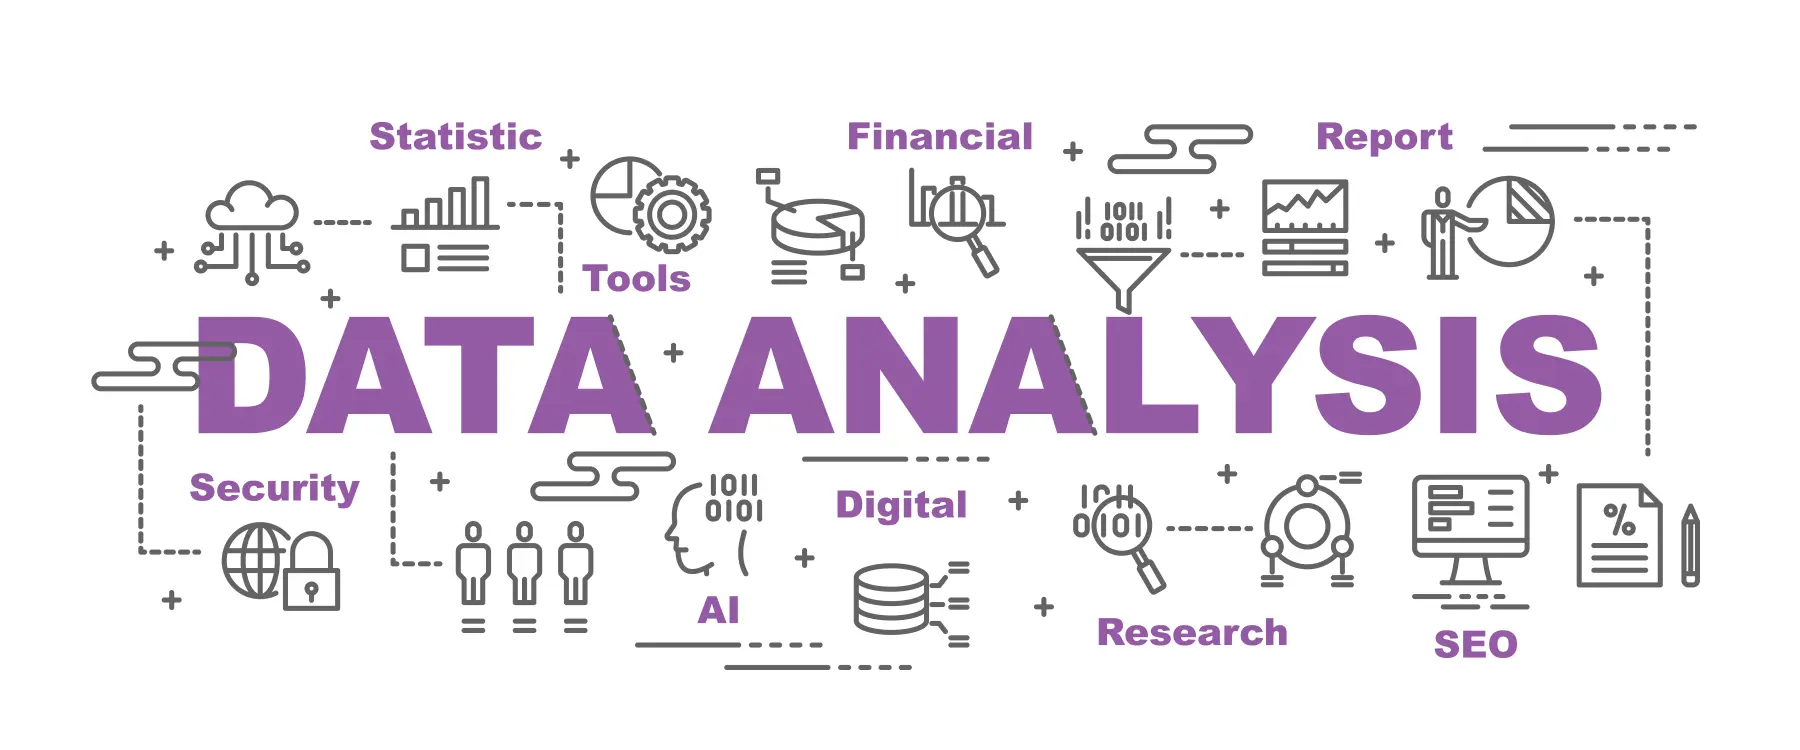
In a world where data is everywhere and grows in volume every day, analyzing data becomes increasingly crucial for businesses, institutions and organizations. Data analytics has long moved beyond searching spreadsheets: it has become the instrument through which organizations gain insights, improve processes, optimize decisions and continue to operate future-proof.
The right analysis at the right time
Data-analyse offers diverse possibilities, from simply describing what happened, through explaining trends and causes, to predicting what may happen and advising on the best choices for the future. Each type of analysis has its own unique methods, application areas and value in the decision-making process.
In this article you will get acquainted with the most important forms of data analytics, including beschrijvende, diagnostische, voorspellende en prescriptieve analyse. Additionally you will find in-depth information about some commonly used analysis techniques such as regressieanalyse, factoranalyse, Monte Carlo simulaties, clusteranalyse en tijdreeksanalyse.
Benieuwd hoe deze analyses kunnen bijdragen aan betere inzichten, efficientere processen of slimmere strategieen in jouw organisatie? Duik in de afzonderlijke pagina’s hieronder en ontdek welke methode het beste aansluit bij jouw vraagstuk!
The 9 most important analysis techniques for business owners
At EasyData we distinguish nine powerful analysis techniques that each play their own role in your business success. Each technique answers different questions and helps you with different challenges:
Beschrijvende analyse
The starting point
Imagine: you look back on the past quarter. How much did you sell? Which products were bestsellers, and which were not? A descriptive analysis answers the question: What happened? Think of it as the quarterly report after a busy season. Nice and clear!
View descriptive analysis →Diagnostische analyse
Why did this happen?
You notice that shoe sales suddenly drop. Why? A diagnostic analysis searches for the cause, just like a doctor examining symptoms. Is it because of bad weather? Changed competition? Thanks to this analysis we discover together why things happen.
Discover diagnostic analysis →Voorspellende analyse
What will happen?
Predicting can be learned! With predictive analysis we use historical data to voorspellen what you can expect in the future. Is the holiday rush and the sale coming up? We show you how much inventory you should stock up, no crystal ball needed!
Verken voorspellende analyse →Prescriptieve analyse
What is the best course of action?
You want to know how many customers you will get tomorrow. What is the best action then? A prescriptive analysis gives concrete advice: which actions deliver the most return? This is your personal coach among the analyses, not only predictive, but also advising on what you should do now.
Discover prescriptive analysis →Tijdreeksanalyse
Patterns over time
Some trends only become visible when you look over months or even years. Time series analysis truly examines your data through time and reveals seasonal patterns and growth lines. Like sunscreen sales that peak every spring: handy for timing your marketing right!
Read more about time series analysis →Regressieanalyse
The relationship between factors
Do you want factual evidence of how much extra revenue you can get if you increase your advertising budget? Regression analysis helps you discover the relationship between multiple factors. Think of the influence of advertising, price and seasons on your revenue, a mathematically clear analysis!
View regression analysis →Factoranalyse
What is really important?
Of the hundreds of data points you collect, often only a few are truly decisive for success. Factor analysis brings those to light. This way you know whether it is the price, your web design or the delivery time that convinces customers.
Discover factor analysis →Clusteranalyse
Who are your customers really?
Not all customers are the same! Cluster analysis groups your customers based on behavior, preferences and characteristics. This way you discover for example that your ‘early birds’ buy very differently than your ‘weekend shoppers’, perfect for targeted marketing!
Verken clusteranalyse →Monte Carlo simulaties
Vooruitkijken in scenario’s
Je wilt weten hoe groot de kans is dat je volgend jaar je verkoopdoelen haalt, ondanks allerlei onzekerheden. Denk aan wisselende grondstofprijzen of onvoorspelbare klantvraag. Met een Monte Carlo-simulatie voer je variaties door in je aannames en zie je welke scenario’s het meest waarschijnlijk zijn.
Go to Monte Carlo simulations →EasyData helps you move forward concretely
All theory is nice of course, but you want to see results! At EasyData we believe in actionable steps and measurable improvements. Our datagedreven aanpak always starts with listening to your specific challenges.
Whether you are struggling with:
- High costs due to inefficient processes
- Unclear reports that raise more questions than answers
- Difficulty predicting supply and demand
- Tijdrovende handmatige data-analyse
We have the experience and tools to help you move forward quickly. With over 25 years of expertise in bedrijfsprocessen automatiseren we know which approach fits your situation.
What you can expect:
Noticeable improvements within the first 3 months. No empty promises, but concrete steps that you immediately notice in your daily practice!

Which analysis fits your challenge?
Together we choose the right analysis technique. Want to get started with something? Then we offer you that opportunity. Feel free to contact for a no-obligation consultation.
From manual data processing to smart automation
Organizations save with our data-driven solutions. From automatic documentverwerking to intelligent data analytics.
What you can expect
✓ Merkbare kostenbesparing in the first year by smart use of data analytics
✓ Inzichtelijke ROI achievable for organizations that effectively implement their transition
✓ Europese datacompliance GDPR-compliant with European data centers and transparent pricing
✓ 25+ jaar expertise and transparent, you always retain control over your data
✓ Snel starten Already have your data? Then quickly start with our cloud-gebaseerde oplossingen
Frequently asked questions about analysis techniques
What is the difference between descriptive and diagnostic analysis?
Descriptive analysis shows what happened (e.g. how many invoices came in last month). Diagnostic analysis searches for the cause: why did processing time increase in quarter 3?
When do you use predictive analysis?
Predictive analysis is valuable when you want to use patterns from the past to estimate future behavior – think of demand forecasts, churn risk or fraud detection. This requires a reliable historical dataset.
How do I know which analysis technique fits my question?
That depends on three factors: (1) what you want to know – looking back, explaining or looking ahead; (2) what data is available; and (3) what you want to do with the result. In a short consultation we help you quickly make the right choice.
Is a lot of data always needed to get started?
Not always. Descriptive and diagnostic analyses are already valuable with limited data. Predictive models require more historical data. We often start with an exploration of what is already available.
Is my data safe with EasyData?
Yes. All your data stays within European data centers and fully complies with GDPR legislation. EasyData does not use external AI services for data processing. More information: beveiliging en datasoevereiniteit.
About the author